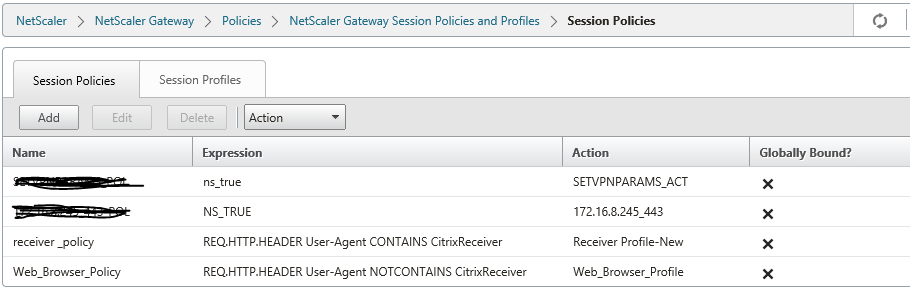
Virtualization - Cloud

Year: 2016 (Page 1 of 2)

Delivery Controller vs Data Collector


Delivery Controller

Data Collector

No LHC LHC(Local Host Cache)
Connection Leasing No Connection Leasing
Pulls all information, static as well as dynamic from the central Site database Has static as well dynamic(run-time) information cached locally
There is no direct communication between delivery controllers.
No scheduled communication between the VDA’s and/or Site databases, only when needed.
Communicates with the IMA store, Peer  Data Collectors and its session Hosts(within its own zone) on a scheduled interval, or when a Farm configuration change has been made.
Is responsible for brokering and maintaining new and existing user session only. Often hosts user session, but can be configured as a dedicated data collector as well.
Can have a different operating system installed then the server and desktop VDA’s Need to have the same operating system as all other session hosts and DC’s within same Farm.
Core services installed only. The HDX stack is part of VDA software Has all the XenApp 6.5 or earlier bits and bytes fully installed.
Zones are optional. When configured they do need at least one Delivery controller present. Each Zone has one Data Collector. Having multiple data collector means multiple zones.
Election does not apply.
Deploy multiple, at least 2 Delivery controllers per site /zone (again one per zone is the minimum)
Can, and sometimes need to be elected. Configure at least one other Session Host per zone that can be elected as a Data Collector when needed.
When Central Site DB is down, no site wide configuration changes are possible. By default, Connection Leasing will kick in, enabling users to launch sessions which are assigned at least once during last 2 weeks prior to DB going offline. when IMA Db is down, no Farm wide configuration changes are possible. Everything else continues to work as expected due to the LHC present on the Data Collectors and Session Hosts in each Zone.
A Delivery controller can have a direct connection(API) with a Hypervisor or cloud platform of choice. Does not have any direct connection(API) with a Hypervisor or cloud platform management capabilities.
Almost all the communication directly flows through a Delivery Controller to Central Site DB. Session Hosts as well as Data Collectors directly communicate with IMA database.
VDA’s needs to successfully register themselves with a Delivery controller. When a XenApp server boots it needs a IMA service but it will not register itself anywhere.


Citrix IMA vs. FMA…

IMA back then…

FMA as it is today…

IMA – Independent Management Architecture. FMA – Flexcast Management Architecture
Farm. Site
Worker Group. Machine Catalog / Delivery Group.
Worker / Session Host / XenApp server. Virtual Delivery Agent (VDA). There is a
desktop OS VDA as well as a server OS
VDA, including Linux.
Data Collector (one per zone). Delivery Controller (multiple per Site).
Zones. Zones (as of version7.7)
Local Host Cache (LHC). Conenction Leasing
Delivery Services Console / App center. Citrix Studio (including StoreFront) and
Director.
EdgeSight monitoring (optional). Partly built into Director
Application folders. Application folders (new feature in 7.6) and
Tags (all 7.x versions).
IMA Data store. Central Site database (SQL only).
Load evaluators. Load management policies.
IMA protocol and service. Virtual Delivery Agents / TCP.
Farm Administrators. Delegated Site Administration using roles
and scopes, which are configurable as well.
Citrix Receiver. Citrix X1 Receiver. It will provide one
interface for both XenApp / XenDesktop as
well as XenMobile.
Smart Auditor. Session Recording.
Shadowing users. Microsoft Remote Assistance, launched
from Director.
USB 2.0. USB 3.0. Support
Session Pre-launch and Session Lingering. Session Pre-launch and Session Lingering.
Both have been re-introduced.
Power and capacity management. Basic power management from the GUI- advanced via powershell
Webinterface / StoreFront. Webinterface / StoreFront.
Single Sign-on for all or most of applications There is no separate Single Sign-On
component available for XenApp 7.x. This is
now configured using a combination of StoreFront, Receiver and policies.
Installed hotfixes inventory Installed hotfixes inventory from studio
Support for Windows Server 2003 and
2008R2.
FMA 7.x supports Windows Server 2008
R2 ,Server 2012 R2,2016


Hyper-V Live Migration terms: brownout, blackout and dirty pages

You may not know about brownouts, blackouts and dirty pages in Hyper-V Live Migrations, but they are useful for monitoring virtual machine live migration

Hyper-V Live Migration is undoubtedly the most sought-after feature of Hyper-V because of its ability to move virtual machines (VMs) between clustered hosts without noticeable service interruption. But in fact, Live Migration can cause brief disruptions in service that end users may not notice.

As an admin, you should understand some lesser-known Hyper-V Live Migration terms that help monitor and troubleshoot service interruption.

Hyper-V event logs contain information about live migration disruptions that can briefly affect VMs. For every VM live migration, these logs report three events: a brownout event, a blackout and dirty-pages event, and a summary of the live-migration process. Understanding these terms also helps you troubleshoot live migrations that take too long and prevent administrative tasks

You’ll find the Live Migration logs in the Application and Services Log -> Microsoft -> Windows -> Hyper-V-Worker

These Hyper-V Live Migration terms are numbered as follows:

Brownout event -22508
Blackout and dirty-pages event -22509
Black out event -20415 ( This is successful event id with blackout time)
Live migration summary event (22507)
Successful Live migration event 20418

hyper-v-livesuccess


A Live Migration brownout event 

A Hyper-V-Worker event log lists the brownout stage first. In the context of virtualization, a brownout is defined as the amount of time it takes to complete the memory-transfer portion of Hyper-V Live Migration. And the term brownout is a good metaphor for this event, because a VM is not affected completely (as the term blackout suggests). The VM is still responsive, but you can’t perform configuration changes or other administrative functions during this stage of the live migration

 hyper-v-live-brown

Above figure indicates that the brownout took 19.43 seconds. This time depends on the size of active RAM the VM uses and the speed of the Live Migration transport network. During this time, the VM is completely responsive as the memory pages move to the destination node. This stage of live migration gets most of a VM’s state over to another node, but not quite all. Since the VM is responsive, users most likely never know that a migration to another node is in process. But VM response may get delayed. You can monitor this delay by constantly pinging the VM with the command ping SERVERNAME –t. You’ll notice brief periods of longer response times, without total disruption of service

Live Migration blackout and dirty-pages event

The final stage in Hyper-V Live Migration is when a VM fully migrates to the destination node of the cluster. This process is called the blackout stage, where, to finally move a VM and all its memory, there is a brief pause in service. During the brownout stage, the host attempts to move all active memory to the destination node. But server memory isn’t completely emptied until this final process, where data is moved to the destination node. A final snapshot provides a last file representation of the remaining memory, which is known as dirty pages. When dirty pages are migrated to the destination node, the blackout occurs.


The blackout period is by no means comparable to the longer saved state in Hyper-V’s former Quick Migration feature, because Live Migration usually moves a very small amount of data during this final stage. But a slight disruption will occur, usually about one to two seconds, or one dropped ping. Unlike during the brownout stage, a VM is not responsive. The event log indicates how long the blackout period was and how many dirty pages were moved during the migration’s final stage (see below Figure)


hyper-v-live-blackout

Note that during a live migration for servers with a higher transaction workload, longer blackout times and a greater number of dirty pages occur.

These two Hyper-V Live Migration terms are important, because the blackout and dirty-pages event are troubleshooting tools. The log tells you for how long a VM was unavailable, which is useful information when a live migration takes longer than expected or when there is a noticeable disruption in service

Live Migration summary event

The final event, 22507, gives a nice summary of the duration of the live migration process

hyper-v-live-summary

Note: Above article written based on Hyper-v 2008 r2 and it is applicable to later version too..

Multiple Virtual Machine’s went into paused in a Hyper-v cluster throwing error “Disk(s) running out of space” – Typical Issue

Environment:
OS: Windows Server 2012 ,10 Node Hyper-v cluster
Model: ProLiant BL460c Gen8
Storage: FC,HP 3PAR
Error Message:
Multiple Virtual Machine’s went into paused state throwing error “Disk(s) running out of space though 30% free space available

Immediate Observations:

  • Only few Virtual machines went to paused state and observed all VM’s are coming from single volume let’s say Volume 1
  • Volume1 is having 30 % free space , checked with storage team whether the LUN is thick or thin as sometimes LUN may be exhausted if they allocated as thin. It is a thick LUN and no issues observed from storage
  • Tried to resume the VM, after sometime VM moving to pause state
  • Tried to move the CSV disk from one node to another – No Luck
  • Observed that there is no single recommended hotfix installed on any node in a cluster but all nodes are up to date with all critical patches

Resolution

  • Based on above findings, assumed that there is some known issues would be there as  error is misleading us to  DISK’s are running out of space though 30% free space available. 
  • As there was no single recommended hotfix  installed in cluster , initially installed Hype-v 2012 hotfixes on one node and taken restart.
  • Move the Victim volume to the recently restarted node. – No issues  observed
  • Post keeping an observation, installed all recommended hotfixes

Finally, I am unsure which hotfix resolved exactly but I have seen below forums where these issues addressed in KB2791729 but it is a private hotfix

Ref:
http://support.microsoft.com/kb/2784261 – Windows Server 2012 Hotfixes

In 15 Node cluster, majority of the virtual machines failed over(restarted) due to network fluctuations while performing network maintenance activity

Environment:
OS: Windows Server 2012
Model: IBM Flex System 8721 (Chasis) Hyper-v Servers are in 2 Chassis
Network : 2 (Public & private), 2 different Switches

Immediate Observations:

  • During network core switch activity, there was a network disturbance for both public & private network interfaces for 30 to 60 sec’s and it is fluctuated in duration of 2 hours
  • Observed the event id’s 1127(network fail),1135(Removal of cluster membership),1177(quorum lost) & 5120(CSV disconnection)

hyper-v-event-1127

hyper-v-event-csv-disconnection

hyper-v-event-1135

hyper-v-event-1177


Immediate Action’s performed

  • As heartbeat is not available & other interface not interrupting , we have increased the heartbeat value by increasing the Same Subnet Threshold  from default 5 sec to 28 Sec.  This value is kept by referring the below blog
  • As per Microsoft recommendation we should not have  samesubnetthreshold value > 20 sec.  Since we observed VLAN flapping is taking 25 sec, we have set the value to 28 to check  , we have changed samesubnetThreshold to 28 which is heartbeat value.  However we can’t set routehistorylength value more than 40 due to limitation.

hyper-vclus

SameSubnetDelay = 1000 ( means 1000 millsec  i.e, 1 sec)
SameSubnetThreshold = 5 (Means , 5 heartbeats)

So, By default total heart beat in a cluster is = Delay * Threshold = 1 sec * 5 HB i.e. cluster can tolerate of 5 HB in 5 sec

Delay – This defines the frequency at which cluster heartbeats are sent between nodes.  The delay is the number of seconds before the next heartbeat is sent.

Threshold – This defines the number of heartbeats which are missed before the cluster takes recovery action

For example setting SameSubnetDelay to send a heartbeat every 2 seconds and setting the SameSubnetThreshold to 10 heartbeats missed before taking recovery, means that the cluster can have a total network tolerance of 20 seconds(2sec *10 HB) before recovery action is taken

hyper-v-disclaimer

Changing of above 28 HB’s would not help us our requirement as network fluctuations are more than 30 sec hence we have  sought Microsoft support for any other best practice and got below recommendations

  • The samesubnedelay and samesubnetthreashold values are very specific to heartbeat settings between cluster nodes/hosts. These changes will help delay the heartbeat checks between the nodes/hosts.
  •  The above changes will not control the way the SMB multi-channel that is used by the Cluster Shared Volumes (CSV). The moment the TCP connection is dropped during the network maintenance activity, the SMB channel will have an impact.
  •  As the SMB connection drops, it will affect the VMs hosted on the CSV volumes. They will not be able to get the metadata for the CSV over the SMB channel.
  •  Due to problems over CSV network (SMB channel), you would see event ID 5120 for CSV volumes. This will impact the VM availability.

So based on the above points, if there is a network outage beyond 10-20 seconds, there will be impact to the cluster and there is no way to avoid this impact on the VM resources. It is recommended to ensure the VMs are moved to the nodes where will be no network impact or to be brought offline gracefully before the network maintenance activity.

Also, MS responded as below for the query which we asked to check and it may not viable in CSV environment as SMB connection drops impacting CSV

Removal and adding of the VM from HA is time consuming and not an easy option and Microsoft do not suggest this option in CSV environment.

Ref: https://blogs.msdn.microsoft.com/clustering/2012/11/21/tuning-failover-cluster-network-thresholds/

All the VM’s are failing over(restarting) unexpectedly from one node to another in 15 Node Hyper-v cluster, post storage firmware up gradation.

Environment:
OS: Windows Server 2012
Model: IBM Flex System 8721 (Chassis)
Hyper-v Servers are 2 Chassis
Storage : IBM SVC7000 over FC
Multipathing existed with IBM DSM

Immediate Observations:
  VM's were impacted post storage firmware upgradation activity
  Post activity completion of 2-4 hours , observed the event id 5120(Status_IO_TimeOut)  & 5142 for all CSV's at different  timings
  Observed continuous event id's 129 & 153 on all Hyper-v base servers from the time storage activity started

hyper-v-event-5120

hyper-v-event-5142

hyper-v-event-129

hyper-v-event-153

hyper-v-event-5

Immediate Action’s performed

  • Planned to start  rebooting of all Hyper-v servers one by one ,initially started rebooting of Coordinator node where the Hyper-v is owning the CSV disk to release the locks and to control the VM’s failover immediately.
  • Post rebooted of  Hyper-v hosts , started moving CSV disk to the server which we rebooted. Post starting of 3 or 4 Hyper-v servers, VM’s failover is controlled . However, observed few VM’s were not able to move or failover manually due to lock’s.
  • Therefore , as a good practice restarted all Hyper-v servers so that storage paths will be reestablished without any issues.

Post resolving the issues, we started to find the root cause  of multipathing failure

We have analyzed as below based on the above event id’s 129,153,5120 & 5142.

Each Cluster node will have direct access to a CSV LUN as well as redirected access over the network and through the node that is the coordinator(owner) of the CSV resource. 5120 errors indicate a failure of redirected I/O,  and a 5142 indicates a failure of both redirected and direct.

Warning events are logged to the system event log with the storage adapter (HBA) driver’s name as the Source.  Windows’ STORPORT.SYS driver logs this message when it detects that a request has timed out, the HBA driver’s name is used in the error because it is the miniport associated with storport.

The most common causes of the Event ID 129 errors are unresponsive LUNs or a dropped request.  Dropped requests can be caused by faulty routers or other hardware problems on the SAN.  If you are seeing Event ID 129 errors in your event logs, then you should start investigating the storage and fibre network

An event 153 is similar to an event 129.  An event 129 is logged when the storport driver times out a request to the disk. The difference between a 153 and a 129 is that a 129 is logged when storport times out a request, a 153 is logged when the storport miniport driver times out a request.

The miniport driver may also be referred to as an adapter driver or HBA driver, this driver is typically written the hardware vendor.

Finally we clearly understood that , between MPIO (IBM DSM) & HBA driver there was a connectivity issue somewhere in the storage stack driver and involved Storage vendor to do deep analysys from storage end.

From Storage team, we  came to know that before storage upgradation activity , Read/Write abnormalities found on volumes i.e, huge Read/write latency found, however they fixed the same before upgradation.

By above statement  & referring few blogs , we understood that ,  in the Draining state volume pends all new IOs and any failed IOs. As storage vendor confirmed that the read/write latency on volumes found abnormal, it would have caused delay in completing I/O for CSV volume and went in to pause state/IO Timeout errors.

There is one timer per logical unit and it is initialized to -1.  When the first request is sent to the miniport the timer is set to the timeout value in the SRB.

The timer is decremented once per second.  When a request completes, the timer is refreshed with the timeout value of the head request in the pending queue.  So, as long as requests complete the timer will never go to zero.  If the timer does go to zero, it means the device has stopped responding.  That is when the STORPORT driver logs the Event ID 129 error.  STORPORT then has to take corrective action by trying to reset the unit.

Also, it is recommended to upgrade HBA driver as it is oldest and CVSFLT.sys,CVSFS.sys by following KB3013767

Ref:

https://blogs.msdn.microsoft.com/ntdebugging/2011/05/06/understanding-storage-timeouts-and-event-129-errors/

https://blogs.msdn.microsoft.com/clustering/2014/12/08/troubleshooting-cluster-shared-volume-auto-pauses-event-5120/

https://blogs.msdn.microsoft.com/clustering/2014/02/26/event-id-5120-in-system-event-log/


Unable to Start any VM in one of the Hyper-V node cluster

Issue:
Unable to Start any VM in one of the Hyper-V node(Windows Server 2012) cluster.

Observations

  • Issue started post upgradation of Symantec, Symantec upgradation is not successful
  • Unable to migrate any VM from another node in a cluster
  • Unable to start any VM in that node. After clicking start, VM is in Starting stage and throwing error after 2-5 minutes.

Error Messages Seen:
TEST failed to start worker process: “server execution failed (0x80080005)”

Troubleshooting done:

  • Given full control to Everyone on  below regkey: HKCR\AppID\{8BC3F05E-D86B-11D0-A075-00C04FB68820}
  • Post giving permission, able to start VM on the host.
  • Compared the registry key permissions with other working machine and found Creator Owner was missing on problem machine. I added it and removed the everyone. Able to start VM
  • To fix WMI and DCOM errors, I  re-registered the dlls  by running below command ( for /f %s in (‘dir /b *.dll’) do regsvr32 /s %s ) to resolve the issue.

Attached is the detailed document with all screenshots. Unable to Start VM -Doc

Issues encountered post deployment of Netscaler VPX 10.5

Issues encountered post deployment of Netscaler 10.5

Requirement:

Customer imported NetScaler 10.5 VPX to Hyper-v and requested us to configure further configurations

Issue 1:Netscaler URL is not opening over internet

Observations & changes done:

Netscaler has 3 Interfaces ( DMZ, LAN Zone & Loopback)

Netscaler Interface


Netscaler IP’s as below

Netscaler IP

  • 172.16.8.X is DMZ Virtual IP. It should be properly natted to public IP 192.X.X.X, then only Netscaler Access gateway web page will open over internet.
  • Network Team will do internal routes from 172.16.8.X to core switches so that it will reach to Citrix infra servers
  • Note that ,172.16.8.x is the virtual IP which you will configure in Gateway virtual server
  • Make sure that 80(STA Port),443(STA Port) ,1494 & 2598 ports opened bidirectional from Netscaler Virtual IP(172.16.8.X) to Citrix infrastructure servers

After above configurations, netscaler web page opening over internet but observed certificate errors and Authentication issue

Issue 2:

User getting error that the credentials are incorrect when logging to Netscaler

Resolution:

The LDAP configuration was not as per the article http://support.citrix.com/article/CTX108876 correcting which rectified the behavior of incorrect username password.

Netscaler LDAP-1


Netscaler LDAP-2


Netscaler LDAP-3

Issue 3: Certificates errors on Netscaler.

Observations & changes done:

  • Observed intermediate & root certificates are missing in NetScaler which creating authentication issues too..
  • From Client end they are able to get authenticating prompt but not able to get establishing the full session
  • Using the openssl command we have verified that the certificate chain is complete and linked on the VPN virtual server on Netscaler Gateway.
    • # /usr/bin/openssl s_client -connect <ip:port> -showcerts

As per article http://support.citrix.com/article/CTX114146

Issue 4:

VDI launching is working with internal URL and not working externally, throwing VDI error

Observations & Changes done

  • Observed session polices were incorrectly configured, created 2 session policies (Web & Receiver Policy)

Using the article http://support.citrix.com/article/CTX139963

Netscaler Session-1

Netscaler Session-2

Netscaler Session-3

Netscaler Session-4

For Receiver, need to configure account services address (Similar to Xenapp Services URL)

Netscaler Session-5

Issue 5:

Error: Cannot complete request, before log into Netscaler webpage and issue is same from internal URL too.

Observations:

  • Load balancing Virtual name(VDIDesktopxx.locaL) is configured in Session profile but these load balancing VIP (SF1+Sf2) were hosted on separate load balancer and there was some issue with load balancing VIP
  • Customer removed Storefront load balancing IP configuration , informing us to point one storefront(SF1) only in Netscaler.
  • Post Load balancing configuration removal, we got the error “Cannot complete request” as netscaler is unable to find the load balance IP

Changes done:

  • Certificate was binded with local load balancing virtual name(VDIDesktopxx.locaL) hence to maintain the same , we created alias entry for SF1 server so that same URL will be accessed internally and the same reachable from netscaler
  • Observed XML was set to false in DDC, recommended to make it true so ran the command set-brokersite -TrustRequestsSentToTheXmlServicePort $true

After doing all above changes, Users are able to launch VDI externally and internally without any issues


XenApp- Applications are unable to launch from DR Web Interface server’s

Issue:

  • Applications are unable to launch from DR Web Interface server’s.

Troubleshooting:

  • Troubleshooting started  with notepad application by mapping to different Xenapp Servers,Web Interface and Zone Data collectors from Pune & Delhi.
  • Issue observed at DR Zone data collector’s(ZDC) as Qfarm /load does not returning any value when we run from both ZDC’s
  • As there is no value returned from ZDC, suspected that ZDC is not contacting database for loading dynamic information.
  • Observed that DR ZDC MF20.dsn(Database connection file) is pointing to the Pune SQL Database – This is incorrect as it is single FARM & FARM database is active in Delhi SQL.

Solution:

  • Reconfigured Pune ZDC02 server to Delhi SQL database  by running the dsmaint config command with new username/password
  • After reconfiguring MF20.dsn file, Zone data collector returning load values when executing qfarm /load and launching applications without any issues

Observations & Recommendation’s :

  • As FARM will connect to only one database , we need to restore the latest backup copy of production database if there is no synch between primary & DR sql servers and reconfigure MF20.dsn during DR Drill -> This is significant step during DR drill
  • SQL mirroring can configure from production to DR SQL Servers to avoid above step.
  • No Hotfixes are installed, need to install hotfix Rollup pack similar to production or latest -> This is critical to avoid known issues

Enabling Jumbo Frames on CISCO UCS blades -Hyperv

How to enable Jumbo Frames for Hyper-v hosted on CISCO UCS blades

Jumbo Frames setting can enable from UCS manager and no need to perform any changes from windows end if servers hosted on CISCO UCS blades

You need to make 3 changes:

  • Set the System Class MTU to 9216
  • Create a QoS policy for the MTU
  • Set the vNIC to have 9000 MTU and QoS policy you have created

To configure Jumbo Frames on UCS it is done as a QoS policy and the configuration guide is in the link below:

http://www.cisco.com/c/en/us/td/docs/unified_computing/ucs/sw/gui/config/guide/2-2/b_UCSM_GUI_Configuration_Guide_2_2/configuring_quality_of_service.html

Whilst you are planning to use Hyper-V as your OS, the following configuration guide is quite useful to understand which components on the UCS you need to configure to enable Jumbo Frames:

http://www.cisco.com/c/en/us/support/docs/servers-unified-computing/ucs-b-series-blade-servers/117601-configure-UCS-00.html

Find the document with screenshots

Document -Jumbo Frames enablement-CISCO UCS

« Older posts

© 2024 Tech Blog

Theme by Anders NorenUp ↑